Mobility Dashboard
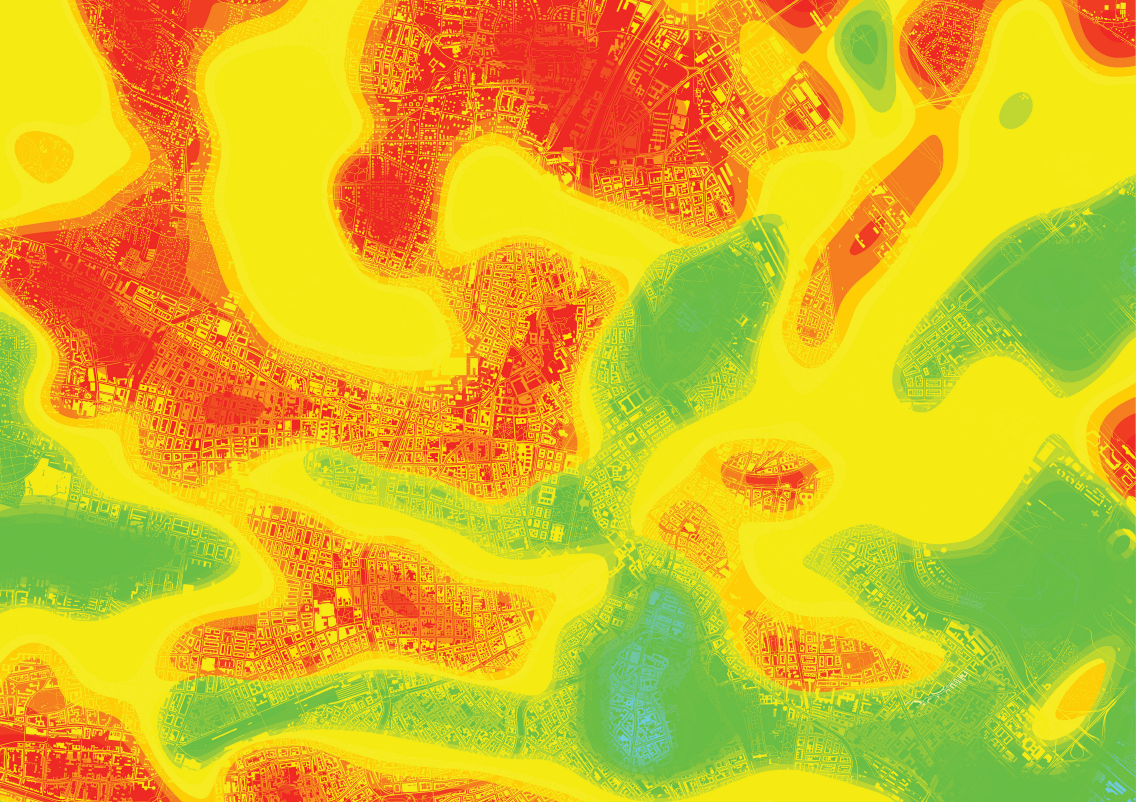
Navigating urban places often poses challenges related to movement, climate comfort, traffic protection, noise, pollution, and more. Based on a scientific approach, our groundbreaking inclusive mobility dashboard translates these challenges into concrete, site-sensitive indicators, or `layers` of urban mobility that the citizens can identify, map, and visualize. Our collaborative mapping toolkit goes beyond traditional data-driven approaches, merging the subjective community knowledge with open data to produce meaningful simulations of Vienna´s urban mobility – and identify its challenges. These interactive simulations, visualized as heatmaps, measure the (un)favorability of movement in various urban areas, providing a context-specific roadmap for improvement based on collective intelligence. By engaging with citizens, especially those with functional diversity, the elderly, and minors, we aim to bridge knowledge gaps and foster a more inclusive, citizen-centered approach to urban mobility.